Line
The Line component renders lines and splines from a set of 3D points.
This is ideal for:
- Visualizing camera trajectories and paths
- Drawing splines and curves
- Creating wireframe visualizations
- Displaying motion trails
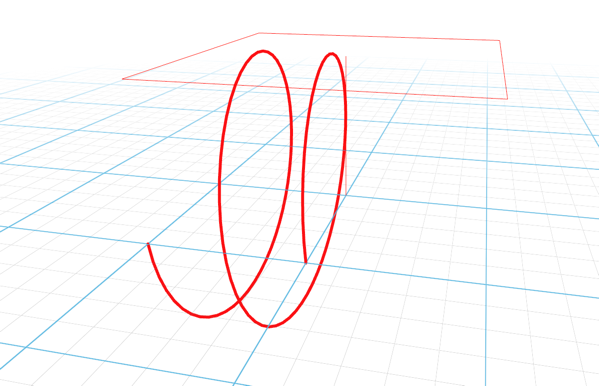
Basic Usage
A minimal example that creates a line from points:
import asyncio
import numpy as np
from vuer import Vuer
from vuer.schemas import DefaultScene, Line, OrbitControls

app = Vuer()

# Create a spiral path
t = np.linspace(0, 4 * np.pi, 100)
points = np.column_stack([
    np.cos(t),
    np.sin(t),
    t / (4 * np.pi)
])

@app.spawn(start=True)
async def main(session):
    session.set @ DefaultScene(
        Line(
            key="spiral",
            points=points,
            color="red",
            lineWidth=3,
        ),
        bgChildren=[
            OrbitControls(key="OrbitControls")
        ],
    )

    while True:
        await asyncio.sleep(1.0)
Key Parameters
| Parameter | Type | Default | Description |
|---|---|---|---|
key |
str | - | Unique identifier for the line |
points |
list/ndarray | - | Array of 3D points (Vector3, Vector2, [x,y,z], [x,y], or numbers) |
color |
str | "black" |
Line color (hex or named color) |
lineWidth |
float | 1 |
Line thickness in pixels |
segments |
bool | False |
If true, renders LineSegments2; otherwise renders Line2 |
dashed |
bool | False |
Enable dashed line rendering |
vertexColors |
list | - | Optional array of RGB values for each point |
Learn More
For detailed examples of using Line, see:
- Spline Frustum - Camera trajectory visualization